Why I Ate a Bug
Neuroscientist Sam Wang (BS ’86) became famous for his hobby—-analyzing elections. Like many others, he predicted Hillary Clinton would win. Wang was so confident in the data, he then made a promise he would have to fulfill…
by Ben Tomlin

Photographed by Chris Sorensen
The rise of big data was supposed to take the uncertainty out of elections. Hot-shot millennial analysts, the story had been well told, engineered precision strategies that helped Obama win, and then keep, the White House. But data analytics wasn’t just for the candidates’ war rooms. Polling had also captured the imagination of the public, who regularly clicked on blogs and websites that served up fevered heat maps, parsing data down to the district, seemingly in almost real time. By 2016, big data for elections had gone mainstream. The citizen analysts behind these blogs themselves gained notoriety, such as Nate Silver at FiveThirtyEight and David Leonhardt of the Upshot. Among them stands Sam Wang, who runs the Princeton Election Consortium.

POLLING DATA COULD BE USED TO COMBAT GERRYMANDERING “Instead of just providing entertainment in the form of predictions, statistical analysis can provide tools to help voters and courts design better laws. In a sense, it’s getting rid of a bug in our democracy.”
A neuroscientist at the university, Wang was one of the first to the game. He began his blog as a hobby in 2004 and quickly gained notoriety for precisely analyzing, and correctly calling, elections. Last fall, Wired magazine called Wang, “The new king of the presidential election data mountain.”
Heading into the final stretch of last year’s contest between Donald Trump and Hillary Clinton, Wang was, like many pollsters, confident that Clinton would win. He was so sure of the data that he infamously tweeted, “It is totally over. If Trump wins more than 240 electoral votes, I will eat a bug.”
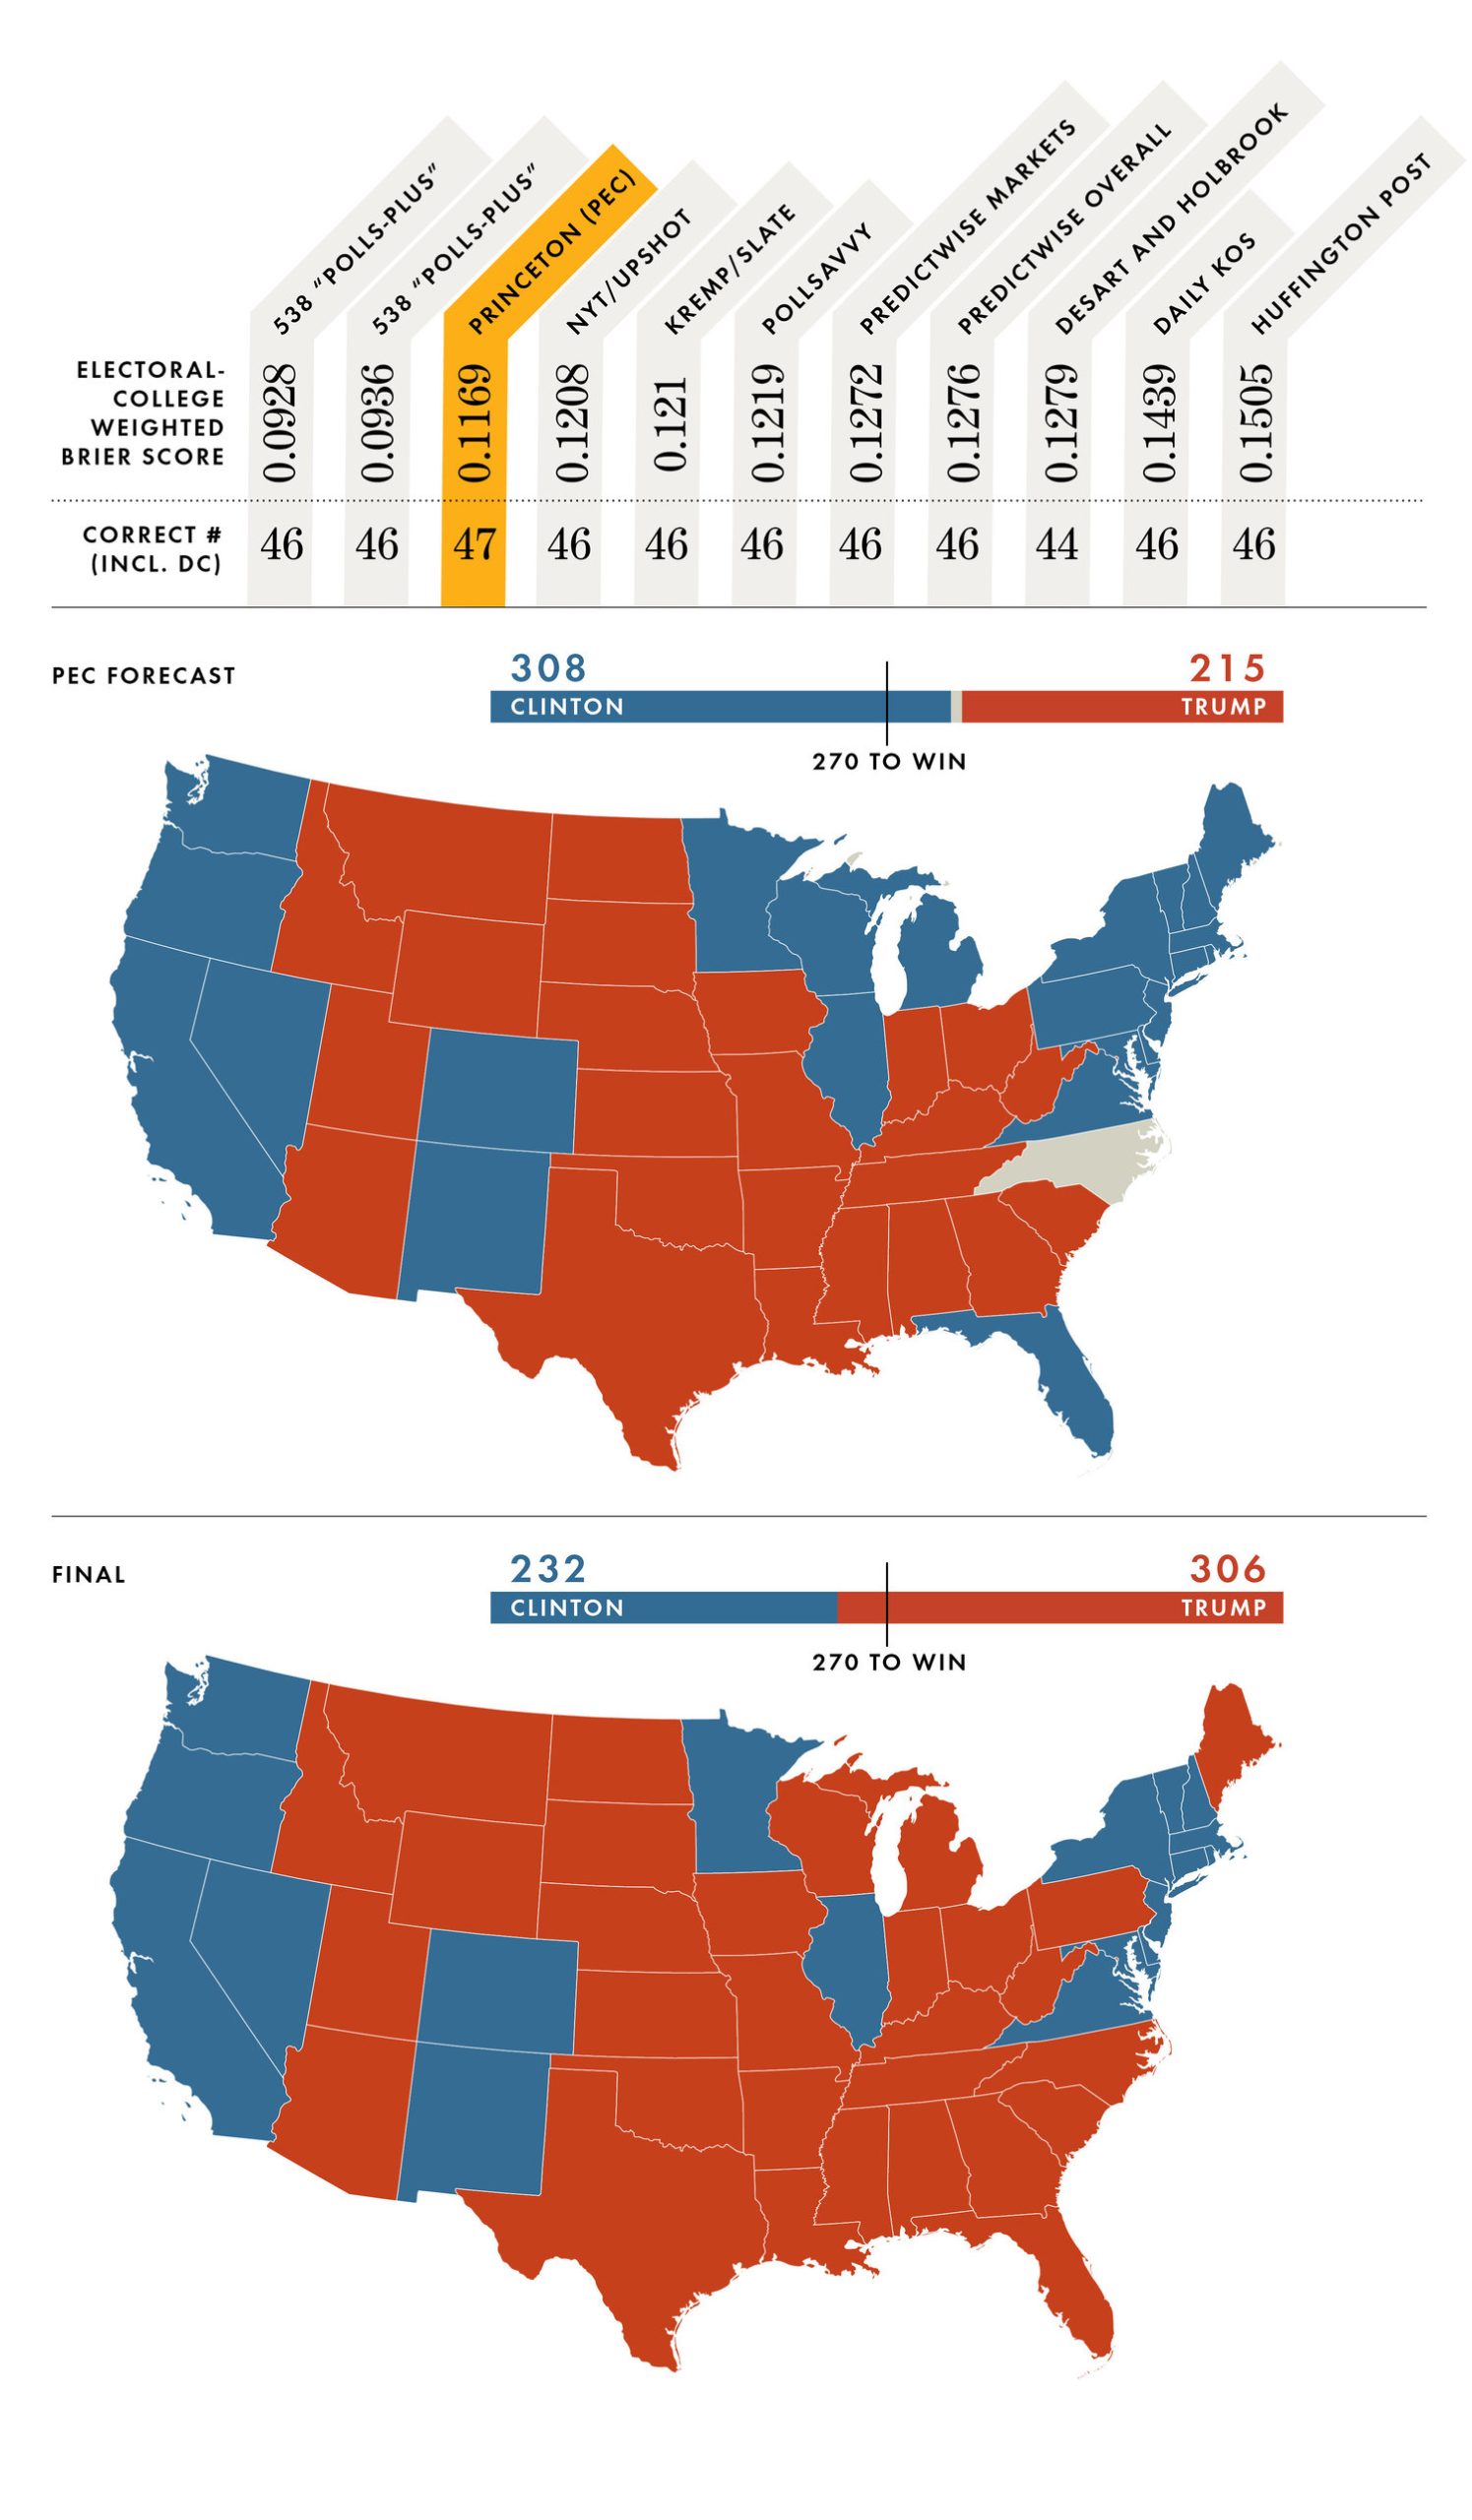
Trump ended up with 307 electoral votes—and the presidency. Wang wasn’t alone in his surprise: Trump’s victory was an upset of almost Dewey-defeats-Truman scale to nearly every pollster. With more data publicly available than any previous presidential election, and more analysts to sift through it all, the question became: How were so many so wrong?
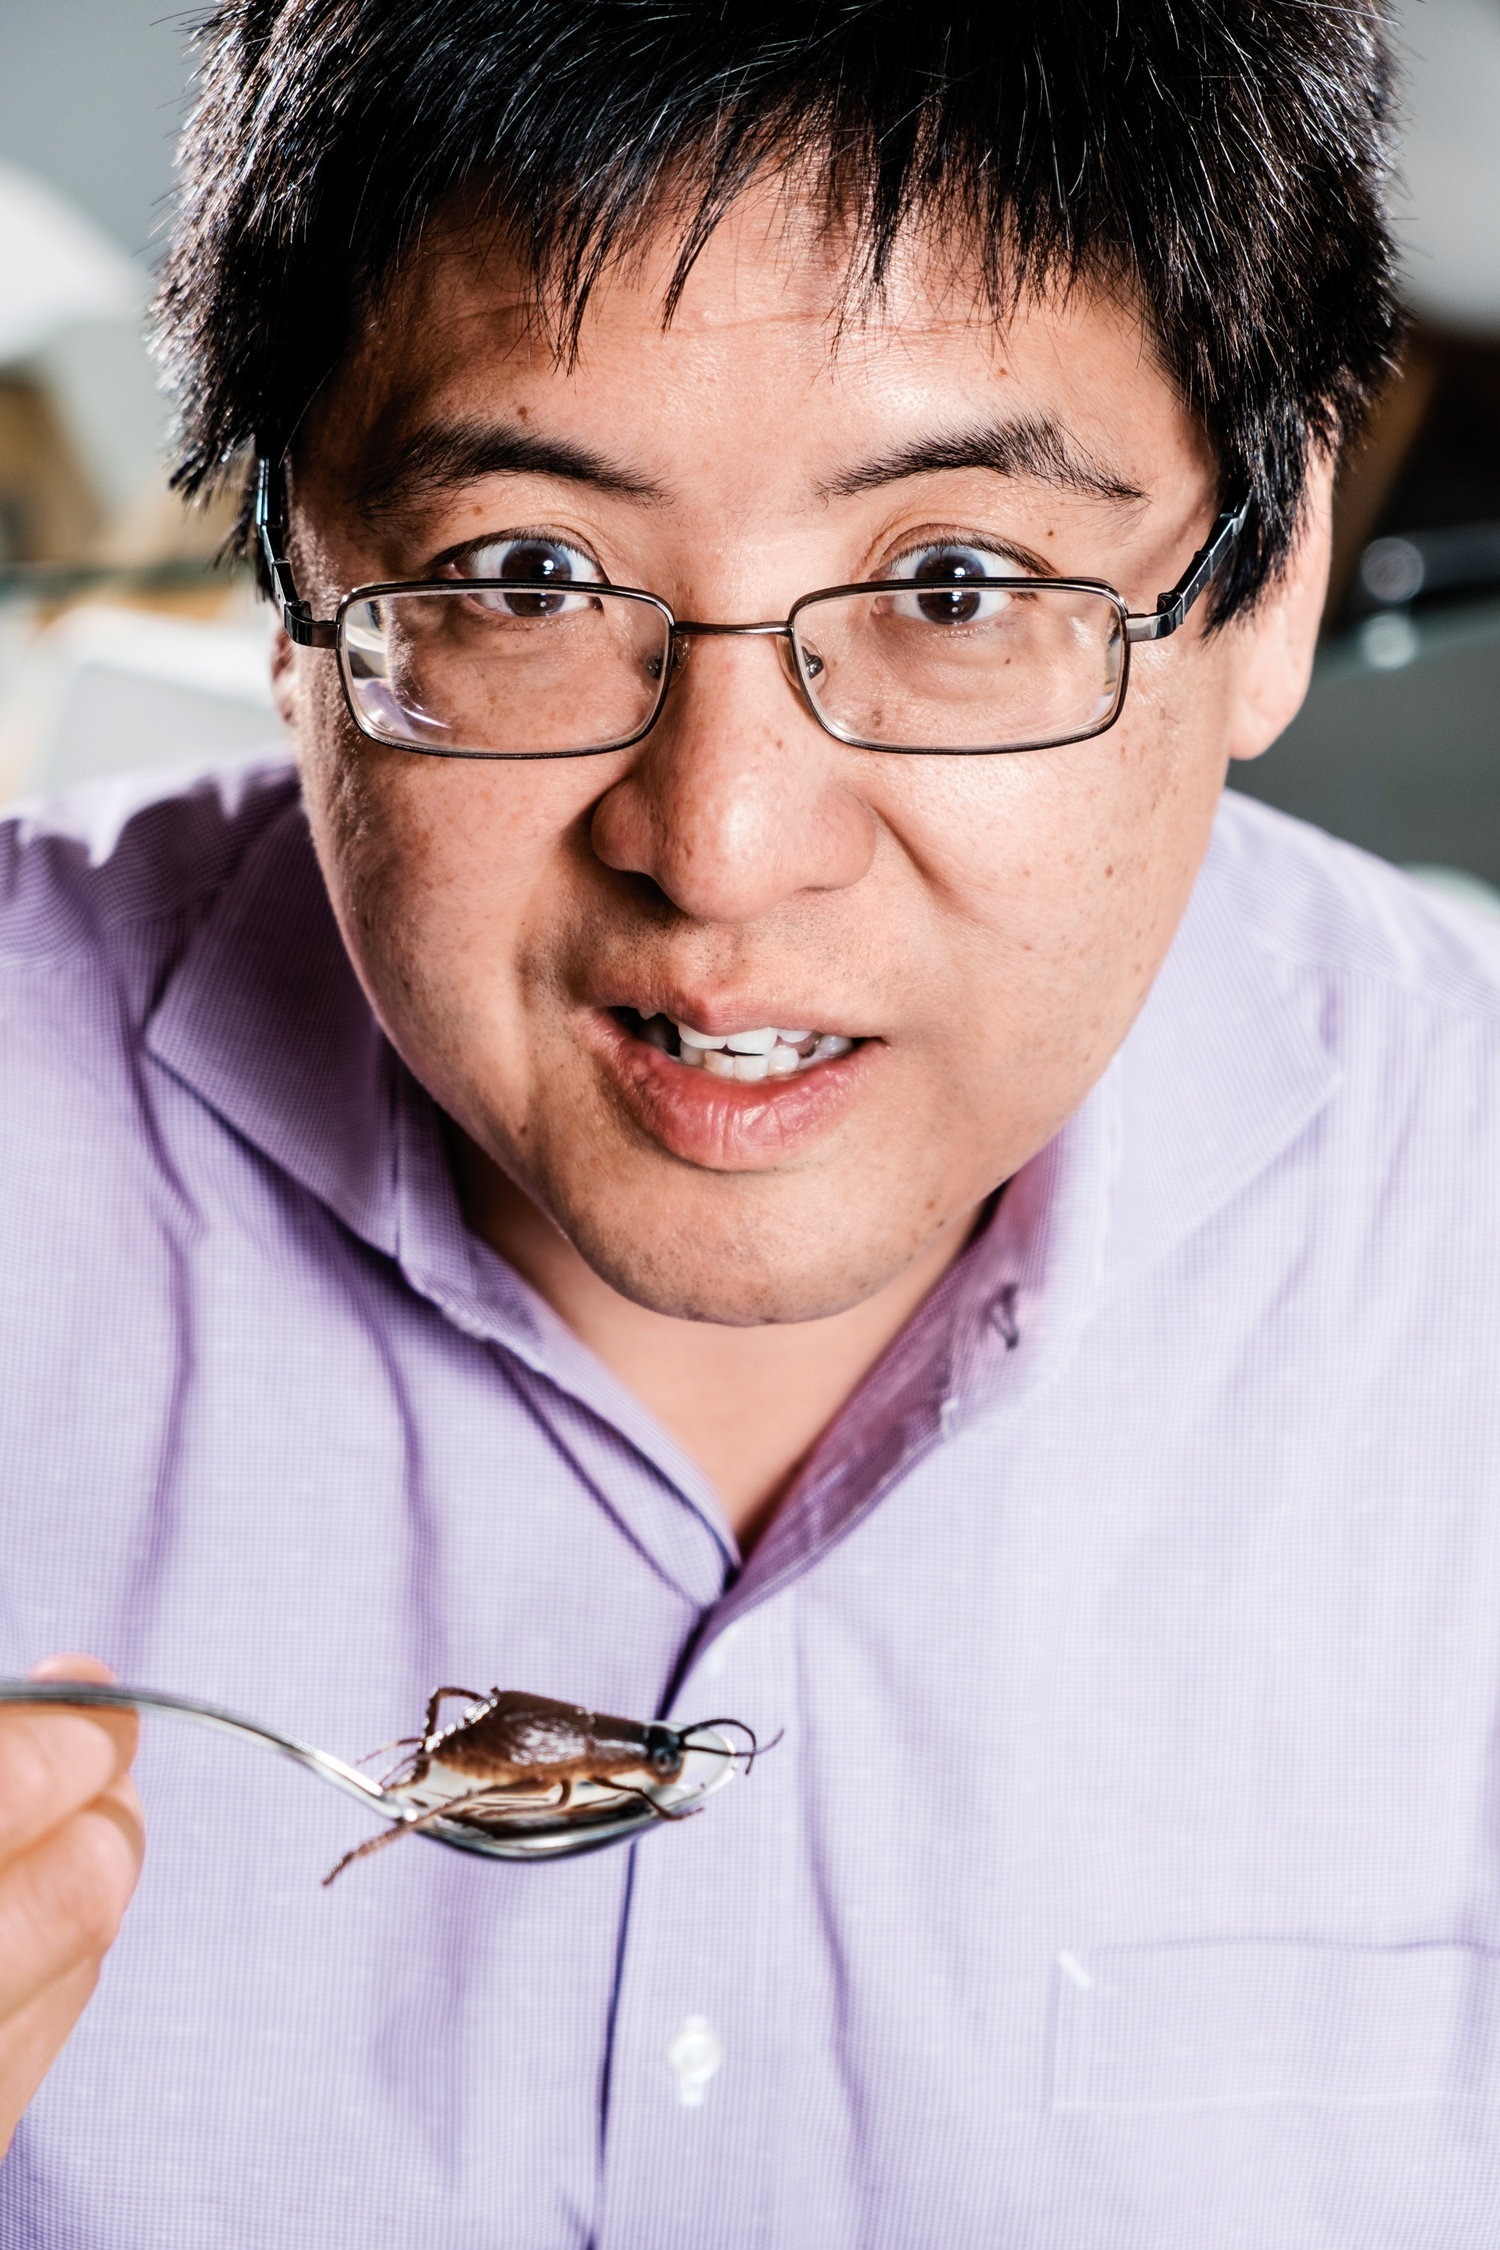
Four days after the election, Wang appeared on CNN to fulfill his promise about the bug, swallowing a raw cricket dipped in honey. But he wasn’t giving up. If anything, this election appears to have invigorated Wang, who continues to study the trends and publish on his site with a new sense of purpose.
We spoke with Wang about how the election of Trump took him by surprise, the lessons he’s learned from it, and how he still has faith that data can shape the future of democracy.
You have built a following for your coverage of election polling, but you’re not a pollster?
That’s right, I’m a neuroscientist. My current research focuses on learning and plasticity—the brain’s ability to have lasting change.
At Bell Labs as a postdoc in 1998, I developed an interest in synaptic learning rules. Synapses are the connections in the brain that allow neurons to pass a signal to one another. Memory and learning are thought to be partly stored in those connections and affected by how strong they are and how frequently they change. At Princeton, I studied how the exact timing of synaptic activity led to plasticity.
Today, I’m primarily focused on the cerebellum, which is found at the back of the brain. We’ve long known that this region is important to coordination, movement, and balance. But I’m interested in the possibility that it may do more. My lab now has some pretty good evidence that the cerebellum may act as a developmental teacher to help organize the brain in early life.
So that’s my day job. Then, as a hobby on the side, I also run the Princeton Election Consortium website.
How did you first become interested in politics?
Back in 1995, when I was just starting out, I did a fellowship in Congress, where I worked for Senator Ted Kennedy on research policy and the use of technology in K–12 schools. That was my first real exposure to government, and it’s held my fascination ever since. Even when I returned to academia full-time, I followed politics closely.
During the 2000 contest between George W. Bush and Al Gore, I started paying attention to state polls. Within the data, I noticed early on that the election seemed to come down to Florida. And indeed, history revealed that to be true. The fact that one state could be so pivotal to an entire election fascinated me.
So I wrote a MATLAB script to model how one could use state polls to track the presidential race between Bush and John Kerry in 2004. I published the results online, demonstrating that the race came down to Florida, Ohio, and Pennsylvania. My post went viral with social scientists, political scientists, and stock traders. It even made the front page of the Wall Street Journal. That was my first exposure to a wider audience, but it was all still a novelty—just a nerdy little story about a scientist crunching numbers.
How did you transition to doing it more regularly?
By 2008, Obama’s first election, I had set up a regular website, the Princeton Election Consortium. My original motivation was to cut through the chaos of news coverage and try to come up with a snapshot of where the race was. It was a hobby, purely an informational resource. I never have made any money from it.
But I wasn’t the only one doing this. Dozens of hobbyists were getting into the mix. And of course everyone knows Nate Silver, whose website FiveThirtyEight went viral that year. With so much data from public pollsters available, the time was right for data-heavy coverage of national politics.
By 2012, poll aggregation really went mainstream and even appeared to contradict the reporting on the race between Obama and Mitt Romney.
Right. Nate went over to the New York Times, where his blog accounted for about 20 percent of visitors in the run-up to that year’s election. A number of other news outlets, such as the Huffington Post and CNN, began to include more tracking analysis.
But while the journalists and data wonks might have been in the same paper, they weren’t necessarily on the same page. There’s a tendency in news to provide equivalency—to make a race between two contenders seem close and down to the wire.
Many news outlets portrayed Mitt Romney as neck and neck with Obama right up to the end. But the poll aggregates—mine, Nate’s, and others’—showed Obama with a clear lead. The question became, who was right? When the results came in—the pre-election polling medians were correct in every single state. Pollsters, as a community, did very well at surveying state opinion. It was a triumph for what we now call data journalism.
That’s not quite what happened last year, though. Most poll analysts predicted a Clinton win. You were particularly confident, saying that her victory was 99 percent certain.
Yeah, the story was much different this time, of course. We were all off—both journalists and poll aggregators. I have to admit that I was particularly off. Painfully so. I think I can talk about it now with some distance.
First, we should remember that despite all of the recent success, polling aggregation and analysis at this scale is young, it has only been around since about 2004. And until this election, the predictions had done well. Even in 2016, there are points where we did well. During the primaries, I used state polls to point out that Mr. Trump was the strong favorite to win the nomination. So we had enjoyed a good track record. But poll aggregation has its limits. It gets rid of only the random sampling noise. If there’s a larger systematic error, then results can go off track. And it turns out, there was such an error lurking in the polls.
For most of the race, Hillary Clinton’s effective lead in state polls was between two and six percentage points. Then you have to take into account an overall systematic error, which historically is around one or two percentage points. Clinton held a lead for most of the season ahead of that margin. She consistently looked positioned for a narrow win at the minimum.
But this election, the overall error in state polls was four points. That’s large, and meant something was systemically off. The entire polling industry—public, campaign-associated, aggregators—ended up with data that missed the results by a very large margin.
In my postmortem analysis, it looks to me like undecided Republican voters—those who couldn’t figure out whether they were really going to support such a radical candidate—showed up as undecided in the polls. But on election day, they stayed loyal to their party.
Indeed the polling error was concentrated in Republican-leaning states. In states that Donald Trump won, the error was an average of six percentage points. In Democratic states where Clinton won, the error was 0.2 percentage points.
We based our predictions on past behavior of all voters, Democrats, Republicans, and undecided voters. But this was an unusual year, where many of the undecideds were in fact Republican. And in the end, they came home en masse.
We were hamstrung by inadequate data—and so we were wrong. In my case, I compounded the error by underestimating the range of uncertainty.

We have to ask about the bug.
Yes, I did eat a bug. It’s not the first time I had said it about an election. I made my first bug comment back in 2012 as a way to emotionally capture the idea that I was pretty confident about a prediction. I said it again this year, and it was picked up by the media and went viral.
So, yes, I had to take my medicine.
But there’s so much to talk about with this election, and now this president. I didn’t want the bug to be a distraction. I figured, let’s go ahead and get it out of the way, then get on to more pressing issues.
What are some of the lessons learned coming out of this election?
One lesson is that we, as aggregators, need to be very careful about expressing too much confidence in predictions. Data geeks, the press, and even the candidates themselves took a tight race and treated it like a near-certainty. I don’t think the public is well served by exact-sounding probabilities. If I had just said in the home stretch, “Hillary Clinton’s effective lead is 2.2 percentage points and there’s uncertainty of several percentage points,” that would be good enough to indicate a close race. I think that polling gives the appearance of precision. But there are inherent uncertainties. We bear blame for not properly conveying them. Next time around, I won’t focus on probabilities—instead I will focus on estimated margins.
I also wrote in an editorial for the New York Times that we might retire the idea of the “undecided” voter. So-called undecideds might be mentally committed to a choice, but either can’t or don’t want to say. Other approaches like web-search data might offer insight to predict their behavior.
Finally I think that there was a media failure too. Reporters and pundits also built a narrative. They looked at the polls, but also their own feelings about the subject, and concluded that it was impossible for Trump to win. So they treated him as a novelty. I think that there’s probably a lesson for all of the media to take a situation seriously even though it may seem absurd.
How do you think polling has helped to shape the way the public approaches elections?
People are interested in understanding the world around them. There’s a traditional way to tell stories, the way journalists do. And now the public has discovered another means of storytelling—through data. Now news outlets are taking the practice further, like the New York Times’ Upshot, which puts the data analytics front and center to tell a story.
What are you focusing on going forward?
In recent years, I’ve become particularly interested in gerrymandering. Political parties have gone to unusual lengths recently to engineer districts to distort representation. There are several ways to address gerrymandering: You could change the laws, or you could go through the courts.
The Supreme Court has said that partisan gerrymandering is an offense that they could regulate, but they haven’t had a clear standard to do so. What if we could create one? Over the past four years, I have developed statistical standards to detect and highlight gerrymanders when they occur, along with tests that are simple enough to be used in court. These were recently published in the Stanford Law Review. So I am a neuroscientist who hobbies as an election analyst—now published in a law journal.
That certainly seems like a lot. [Laughs] Well, there are some intersections between these fields. Neuroscience is very much a domain where large-scale data-crunching is necessary. But I also think that’s something Caltech helped to instill. Caltech is a place where you’re continuously exposed to different subjects and problems. When jumping into a new field, I have to respect it, but I don’t need to be afraid of it. And sometimes an outsider can add a fresh viewpoint.
Where do you see this headed?
There are three cases coming up before the Supreme Court that could use the new standards I mentioned. If this methodology is adopted, then my dream is for courts to be able to make use of them even without experts. I’ve even created a website to automatically calculate my proposed standards: gerrymander.princeton.edu. My hope is for people to just type in the results for an election and see how it compares.
Instead of just providing entertainment in the form of predictions, statistical analysis can provide tools to help voters and courts design better laws. In sense, it’s getting rid of a bug in our democracy.
And these days I am definitely in an anti-bug mood.